

The State of the Reno-Sparks Real Estate Market — June 2026
The State of the Reno-Sparks Real Estate Market
June 2026 was the strongest month in the Reno-Sparks real estate market for median sales price ever. The median sales price of $644,000 is an all-time high, up 4.5 percent year-over-year and 14 percent above where 2022 began. The 517 closed sales in June are the most of any month in four and a half years—more than even the frenzied spring of 2022, when interest rates were still in the 3 percent and 4 percent range. New pending sales (489) were the highest June figure since 2021, and days on market sat at 49, right in line with recent Junes despite meaningfully higher prices.
What makes this June different from the last three is supply. The end-of-month inventory of 909 homes is down 26 percent from June 2025’s 1,229 homes, and new listings fell 8.5 percent year-over-year. Demand rose while supply contracted—that combination is what pushed the median sales price past $600,000 in April, $635,000 in May, and $644,000 in June. Months of inventory in June 2026 sits at roughly 1.8, the tightest June reading since 2023 and well below June 2022 (2.7), June 2024 (2.3), and June 2025 (2.7).
Seasonal Trends: A Strong Spring
The Reno-Sparks market has a reliable seasonal rhythm: prices bottom out in December–January, climb through spring, peak in May–June, then drift down through fall. Every year follows it. What distinguishes 2026 is the amplitude of the spring run. The market gained roughly $91,500 from the January median ($552,500) to June ($644,000) — a 16.6 percent intra-year swing. By comparison, the 2025 spring run was about $47,000 and 2024’s about $65,000.
The first half of 2026 also outperformed on volume: 2,478 closed sales, the most for any January–June period since 2022’s 2,726, and pending sales almost kept pace with new listings. For every 100 homes that came on the market, more than 85 went pending. That absorption rate is the strongest first half since 2023 and a marked step up from 2025 (76 for every 100) and 2024 (79 for every 100). The market is digesting new supply faster than it has in three years.
In the second half of every year, this trend softens. If 2026 follows form, expect inventory to build through summer, days on market to lengthen into fall, and the median to retreat from the June peak.
Trends to Make Sellers Happy
Nearly everything in the current snapshot is reassuring news for sellers. Reno-Sparks has not run out of buyers. A record median price with three consecutive months of gains. The highest closing and pending volume in years. Shrinking inventory against falling new-listing counts, which means less competition. Days on market compressed from 76 in February to the mid-40s to 49 by late spring. And expired/withdrawn (unsold) listings as a share of market outcomes ran meaningfully lower through the 2026 spring than in the 2022 correction or the 2024–25 falls. A well-priced home in this market sells, and sells faster than it has since 2023.
Trends to Make Buyers Happy
Buyers are not without leverage or good news. Rates, while still elevated by pre-2022 standards, have eased slightly. The national average was 6.49 percent in June 2026 versus 6.82 percent a year earlier and a 7.62 percent peak in late 2023. Despite the record prices, this is not 2021 or early 2022’s market velocity: 49 days on market versus 39 in May 2022 sounds insignificant but reflects a substantial difference in supply-demand balance. Inventory near 1.8 months is tight but not the half-month conditions of 2020–2021. Seasonality is a genuine tool: buyers who can transact in fall and early winter have historically captured median prices 5–10 percent below the spring peak—the winter dip shows up every single year. And there’s always a pool of aging listings (the unsold count never goes to zero) where motivated sellers negotiate.
It is important to note that buyer concessions are not reflected in the purchase price. In both resales and new construction, in my experience, it is still relatively common for buyers to successfully negotiate concessions towards closing costs or a rate buy-down. They will elect to focus their negotiations on concessions rather than on purchase price.
Buyers are rate-sensitive. The 2022 correction reflects a classic interest rate shock: as the national average climbed from 3.45 percent in January 2022 to 6.9 percent by October, closed sales collapsed from 515 in May to 235 by January 2023 and the median fell nearly 17 percent from its peak. Conversely, the 2026 surge coincides with rates settling into the low-6 percent range. The psychological shift from “rates might hit 8” to “rates are drifting down” appears to have unlocked pent-up demand. Additionally, buyers’ realization that rates aren’t going to be in the 4 or maybe even 5 percent range any time soon has motivated some who were waiting for better rates to accept the present reality.
Appreciation Trends
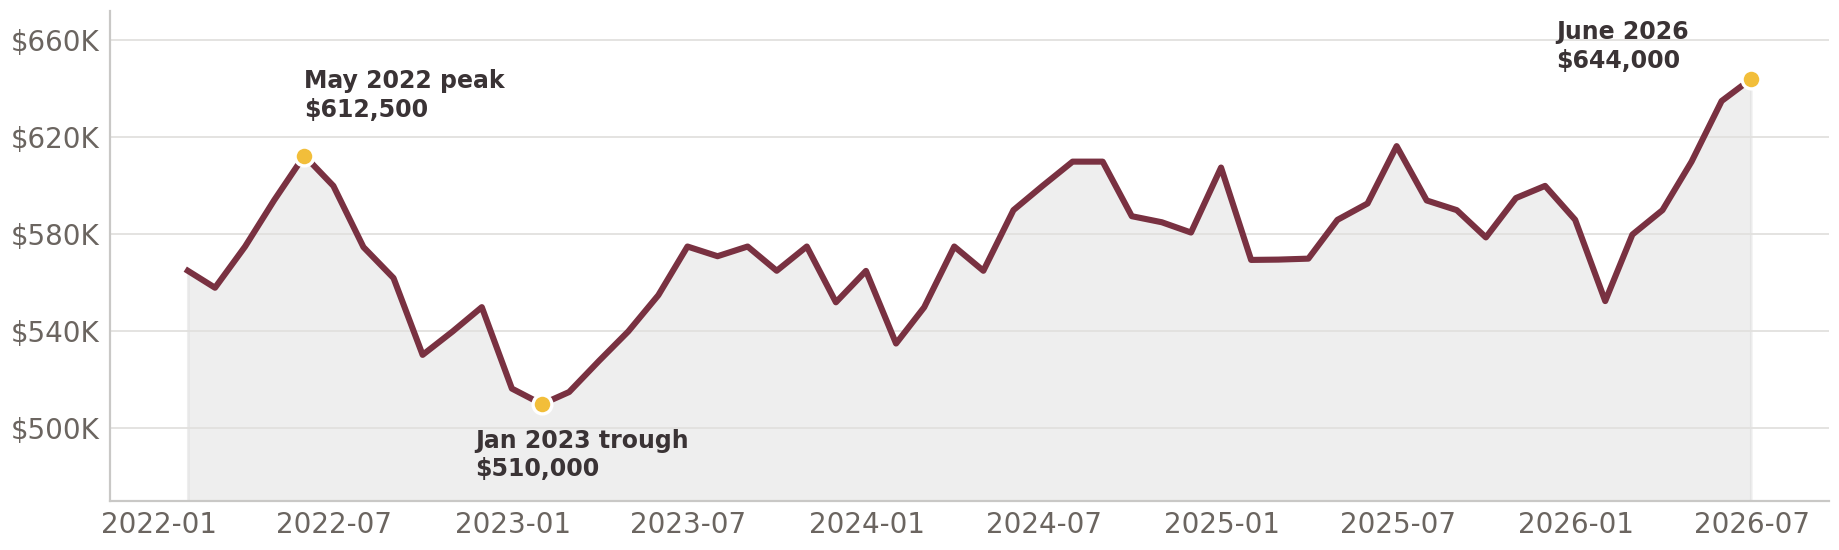
The path from the January 2022 baseline of $565,000 has been anything but a straight line. Prices ran up 8.4 percent to a $612,500 peak in May 2022, then the rate shock took hold. By January 2023 the median had fallen to $510,000—16.7 percent off the peak. Recovery came in stages. By June 2023 the median recovered to $575,000—still 6.1 percent below the May 2022 peak. It slipped again in the winter of 2023–2024, falling to 12.7 percent below peak in January 2024, then climbed back to within 2 percent of peak by mid-2024. June 2025 marked a milestone: at $616,400, the median edged past the old peak for the first time. After the usual winter retreat (9.8 percent below peak in January 2026), the spring 2026 surge carried the median to $644,000 — 5.1 percent above the May 2022 peak and 26.3 percent above the January 2023 trough.
One caveat: the median sales price reflects what sold, not what homes are worth—a month heavy with new construction or luxury closings lifts the number without any individual home appreciating.
What to Expect
If the market follows its established rhythm—and it has consistently in the post-2020 market—expect the second half of 2026 to cool in predictable ways: inventory building through late summer, days on market stretching back into the 60s by fall, and the median sales price retreating from the June peak. That softening is seasonal, not structural, and should not be mistaken for a change in the market’s underlying health.
Three things are worth watching. First, watch interest rates. The national average has quietly climbed from 6.05 percent in February to 6.49 percent in June. This spring’s demand surge happened despite that drift upward. If rates continue rising toward 7 percent, the rate sensitivity this market has demonstrated repeatedly could reassert itself in the fall numbers. Nobody can predict where rates will go in the current geopolitical environment.
Second, watch supply. Record prices tend to draw sellers off the fence. If new listings accelerate in the second half while seasonal demand fades, the 26 percent year-over-year inventory deficit could close quickly—and with it, more of the pricing power many sellers have enjoyed.
Third, watch pending sales relative to new listings. As long as pending sales stay healthy through the fall relative to new supply, the spring 2027 setup remains encouraging for sellers. If the ratio of new pending sales to new listings deteriorates faster than the usual seasonal pattern, that is an indication that buyers’ negotiating power will increase.
So far, the market is shaping up for a typical seasonal descent from an unusually strong peak, putting the market at a higher floor entering 2027 than it had entering 2026.